🤩 Cell-Type Proportion Exploration
| # import packages
import scimap as sm
import anndata as ad
|
| # Load the data that we saved in the last tutorial (with ROIs added)
adata = ad.read_h5ad('/Users/aj/Dropbox (Partners HealthCare)/nirmal lab/resources/exemplarData/scimapExampleData/scimapExampleData.h5ad')
|
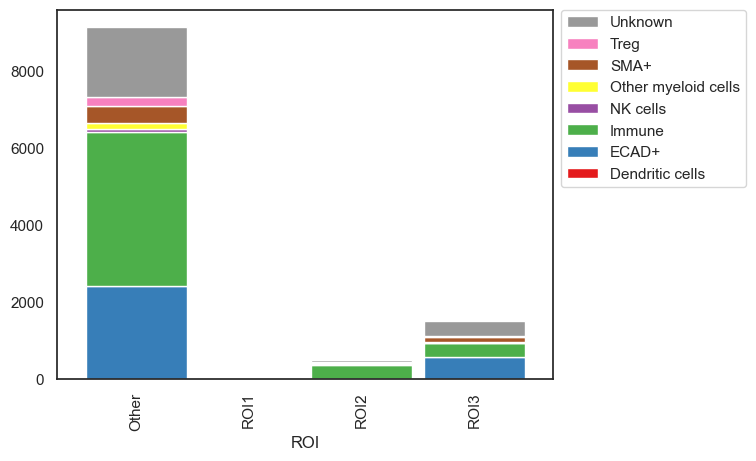
Investigate cell-type composition within the ROI's
| # plots the absolute count of cells within each ROI
sm.pl.stacked_barplot (adata,
x_axis='ROI',
y_axis='phenotype',
method='absolute')
|
| # Plot the number of cells normalized to 100%
sm.pl.stacked_barplot (adata,
x_axis='ROI',
y_axis='phenotype',
method='percent')
|
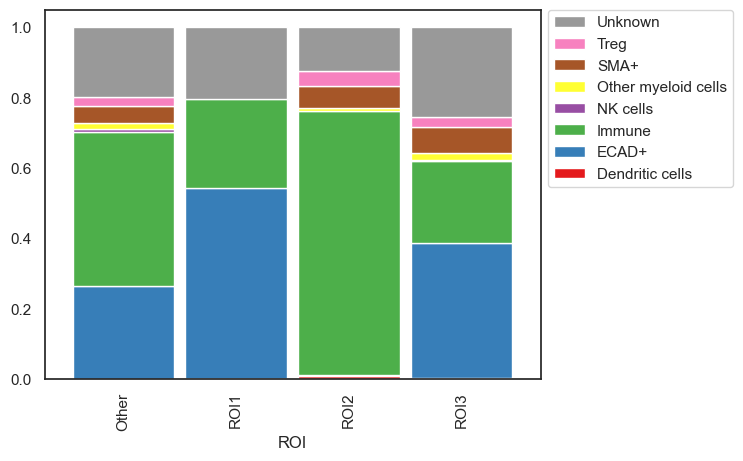
The stacked_barplot function offers numerous additional parameters for customization. For further details, consult the documentation. For instance, it allows for plotting specific cell types, defining custom orders for both the x and y axes, passing custom color schemes, and more.
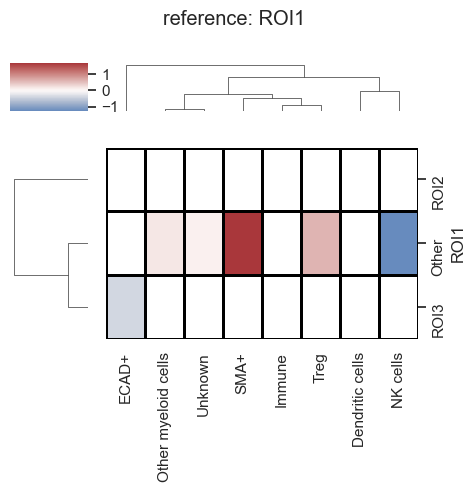
Compute the fold change in cell types across various ROIs.
| adata = sm.tl.foldchange (adata,
from_group=['ROI1'],
to_group=None,
imageid='ROI',
phenotype='phenotype',
normalize=True,
subset_phenotype=None,
label='foldchange')
|
calculating foldchange
calculating P values


/Users/aj/miniconda3/envs/scimap/lib/python3.10/site-packages/scimap/tools/foldchange.py:110: FutureWarning:

Setting an item of incompatible dtype is deprecated and will raise in a future error of pandas. Value '['ROI1', 'ROI1', 'ROI1', 'ROI1', 'ROI1', ..., 'ROI1', 'ROI1', 'ROI1', 'ROI1', 'ROI1']
Length: 59
Categories (1, object): ['ROI1']' has dtype incompatible with category, please explicitly cast to a compatible dtype first.

/Users/aj/miniconda3/envs/scimap/lib/python3.10/site-packages/scimap/tools/foldchange.py:111: FutureWarning:

Setting an item of incompatible dtype is deprecated and will raise in a future error of pandas. Value '['Immune', 'ECAD+', 'Immune', 'Immune', 'Immune', ..., 'Unknown', 'Unknown', 'ECAD+', 'ECAD+', 'ECAD+']
Length: 59
Categories (3, object): ['ECAD+', 'Immune', 'Unknown']' has dtype incompatible with category, please explicitly cast to a compatible dtype first.

/Users/aj/miniconda3/envs/scimap/lib/python3.10/site-packages/scimap/tools/foldchange.py:116: FutureWarning:

Setting an item of incompatible dtype is deprecated and will raise in a future error of pandas. Value '['Other', 'Other', 'Other', 'Other', 'Other', ..., 'Other', 'Other', 'Other', 'Other', 'Other']
Length: 11142
Categories (3, object): ['Other', 'ROI2', 'ROI3']' has dtype incompatible with category, please explicitly cast to a compatible dtype first.
| # Now let's plot the results
sm.pl.foldchange (adata, label='foldchange', method='heatmap', p_val=0.05, nonsig_color='grey', figsize=(5,5),
log=True, center=0, linecolor='black',linewidths=1)
|
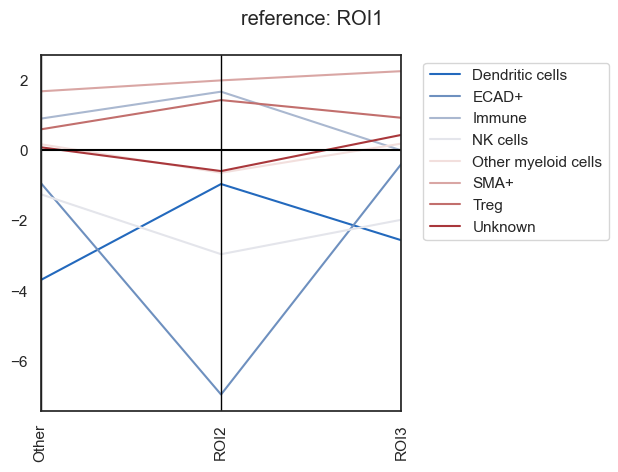
| # lets plot the same results differently (this would be more useful when you have more groups to compare)
# Parallel_coordinates plot of the foldchanges
sm.pl.foldchange (adata, label='foldchange',
log=True, method='parallel_coordinates',
invert_axis=True,
xticks_rotation=90,
return_data = False)
|
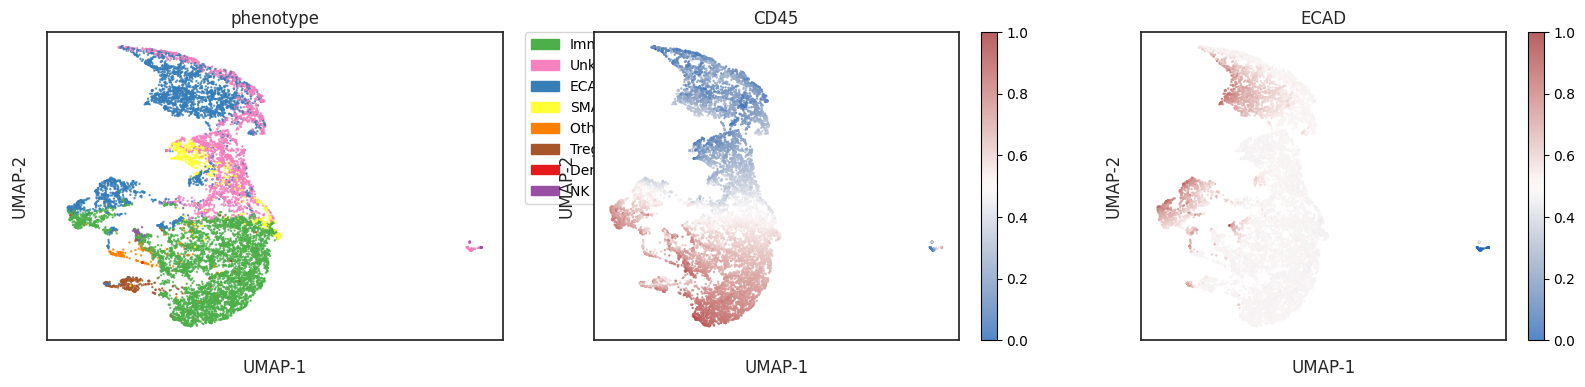
Exploring the phenotypes overlaid on a UMAP
| # view the phenotype on a UMAP
adata = sm.tl.umap(adata)
|
/Users/aj/miniconda3/envs/scimap/lib/python3.10/site-packages/umap/umap_.py:1943: UserWarning:

n_jobs value -1 overridden to 1 by setting random_state. Use no seed for parallelism.
| sm.pl.umap(adata, color=['ECAD', 'CD45', 'phenotype'], s=0.5, figsize=(20, 4))
|
/Users/aj/miniconda3/envs/scimap/lib/python3.10/site-packages/scimap/plotting/umap.py:290: UserWarning:

No data for colormapping provided via 'c'. Parameters 'cmap' will be ignored
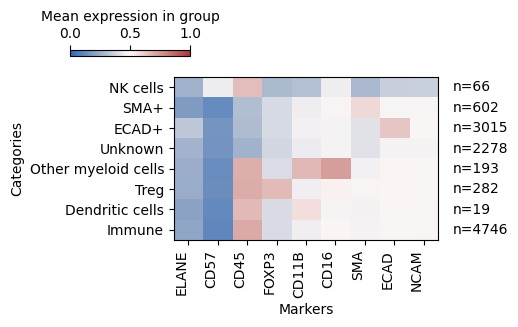
Exploring the expression of markers with phenotypes
| # Heatmap (here values over 0.5 are considered positive as we have scaled the data)
sm.pl.heatmap(adata, groupBy='phenotype', standardScale=None, figsize=(6,3), showPrevalence=True, vmin=0, vmax=1)
|
/Users/aj/miniconda3/envs/scimap/lib/python3.10/site-packages/scimap/plotting/heatmap.py:312: UserWarning:

This figure includes Axes that are not compatible with tight_layout, so results might be incorrect.
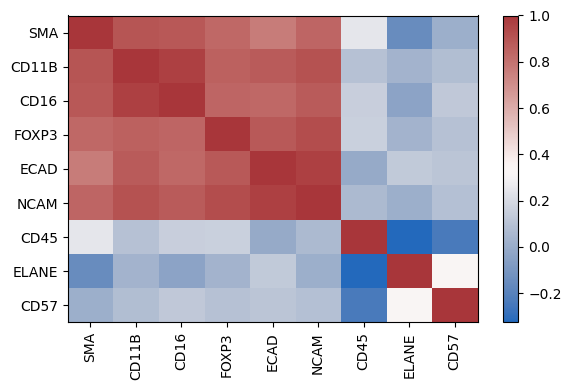
Exploring the correlation of markers
| sm.pl.markerCorrelation(adata, figsize=(6,4))
|
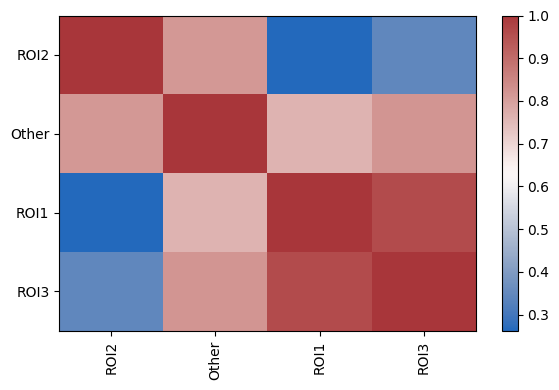
Exploring the correlation of abundance of cell types between conditions
| sm.pl.groupCorrelation(adata, groupBy='ROI', condition='phenotype', figsize=(6,4))
|
/Users/aj/miniconda3/envs/scimap/lib/python3.10/site-packages/scimap/plotting/groupCorrelation.py:127: FutureWarning:

The default of observed=False is deprecated and will be changed to True in a future version of pandas. Pass observed=False to retain current behavior or observed=True to adopt the future default and silence this warning.
Save Results
| # Save the results
adata.write('/Users/aj/Dropbox (Partners HealthCare)/nirmal lab/resources/exemplarData/scimapExampleData/scimapExampleData.h5ad')
|