CellType Proportion Exploration
| """
Created on Mon May 16 19:00:32 2022
@author: Ajit Johnson Nirmal
SCIMAP tutorial May 2022
"""
|
| # load packages
import scimap as sm
import scanpy as sc
import pandas as pd
import anndata as ad
|
Tutorial material
You can download the material for this tutorial from the following link:
The jupyter notebook is available here:
| common_path = "/Users/aj/Dropbox (Partners HealthCare)/conferences/scimap_tutorial/may_2022_tutorial/"
#common_path = "C:/Users/ajn16/Dropbox (Partners HealthCare)/conferences/scimap_tutorial/may_2022_tutorial/"
|
| # load data
#adata = sm.pp.mcmicro_to_scimap (image_path= str(common_path) + 'exemplar_001/quantification/unmicst-exemplar-001_cell.csv')
#manual_gate = pd.read_csv(str(common_path) + 'manual_gates.csv')
#adata = sm.pp.rescale (adata, gate=manual_gate)
#phenotype = pd.read_csv(str(common_path) + 'phenotype_workflow.csv')
#adata = sm.tl.phenotype_cells (adata, phenotype=phenotype, label="phenotype")
# add user defined ROI's before proceeding
|
| # load saved anndata object
adata = ad.read(str(common_path) + 'may2022_tutorial.h5ad')
|
AnnData object with n_obs × n_vars = 11170 × 9
    obs: 'X_centroid', 'Y_centroid', 'Area', 'MajorAxisLength', 'MinorAxisLength', 'Eccentricity', 'Solidity', 'Extent', 'Orientation', 'imageid', 'phenotype', 'index_info', 'ROI', 'ROI_individual'
    uns: 'all_markers', 'dendrogram_phenotype'
Investigate cell-type composition within the ROI's
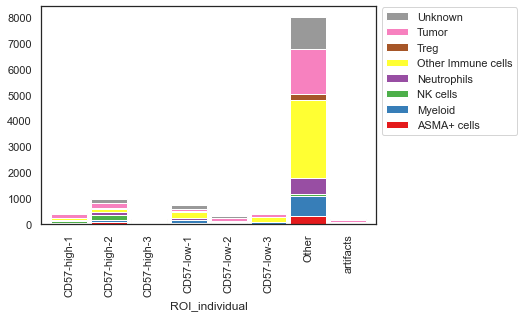
| # https://scimap.xyz/All%20Functions/C.%20Plotting/sm.pl.stacked_barplot/
sm.pl.stacked_barplot (adata,
x_axis='ROI_individual',
y_axis='phenotype',
method='absolute')
|
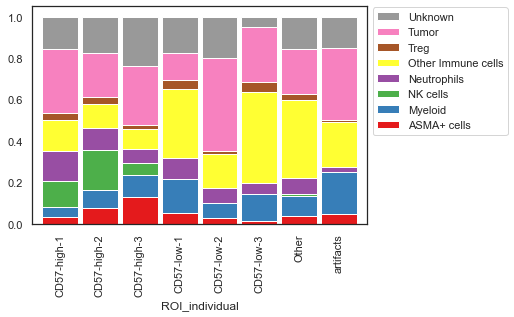
| # Plot the number of cells normalized to 100%
sm.pl.stacked_barplot (adata,
x_axis='ROI_individual',
y_axis='phenotype',
method='percent')
|
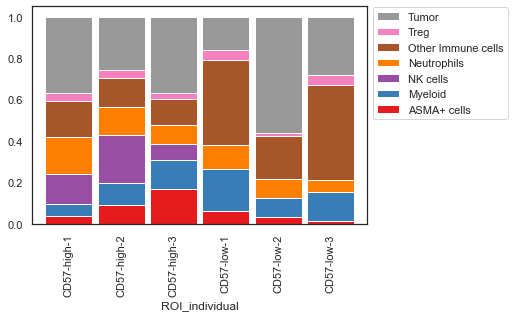
| # specify the elements to be in the plot
x_axis_elements = ['CD57-low-1', 'CD57-low-2', 'CD57-low-3', 'CD57-high-2', 'CD57-high-1', 'CD57-high-3']
y_axis_elements = ['ASMA+ cells', 'Myeloid', 'NK cells', 'Neutrophils', 'Other Immune cells', 'Treg', 'Tumor']
|
| # replot
sm.pl.stacked_barplot (adata,
x_axis='ROI_individual',
y_axis='phenotype',
method='percent',
subset_xaxis=x_axis_elements,
subset_yaxis=y_axis_elements)
|
| # quiet a number of parameters to play around:
sm.pl.stacked_barplot (adata,
x_axis='ROI_individual', y_axis='phenotype',
subset_xaxis=x_axis_elements, subset_yaxis=y_axis_elements,
order_xaxis=None, order_yaxis=None,
method='percent', plot_tool='plotly',
matplotlib_cmap=None,
matplotlib_bbox_to_anchor=(1, 1.02),
matplotlib_legend_loc=2,
return_data=False)
|
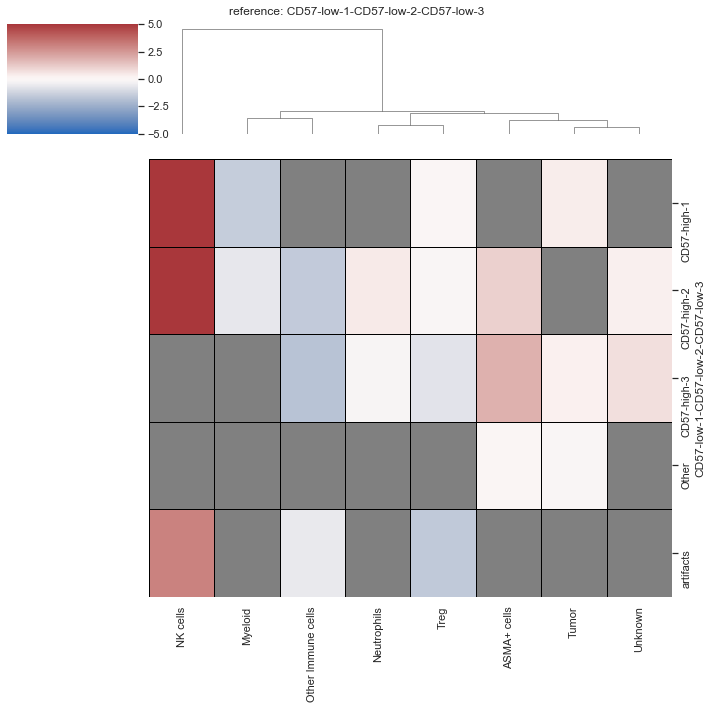
Calculate the fold change in cell types between the different ROI's
| adata = sm.tl.foldchange (adata,
from_group=['CD57-low-1', 'CD57-low-2', 'CD57-low-3'],
to_group=None,
imageid='ROI_individual',
phenotype='phenotype',
normalize=True,
subset_phenotype=None,
label='foldchange')
|
/opt/anaconda3/envs/scimap/lib/python3.9/site-packages/scimap/tools/_foldchange.py:102: SettingWithCopyWarning:


A value is trying to be set on a copy of a slice from a DataFrame.
Try using .loc[row_indexer,col_indexer] = value instead

See the caveats in the documentation: https://pandas.pydata.org/pandas-docs/stable/user_guide/indexing.html#returning-a-view-versus-a-copy

/opt/anaconda3/envs/scimap/lib/python3.9/site-packages/scimap/tools/_foldchange.py:103: SettingWithCopyWarning:


A value is trying to be set on a copy of a slice from a DataFrame.
Try using .loc[row_indexer,col_indexer] = value instead

See the caveats in the documentation: https://pandas.pydata.org/pandas-docs/stable/user_guide/indexing.html#returning-a-view-versus-a-copy

/opt/anaconda3/envs/scimap/lib/python3.9/site-packages/scimap/tools/_foldchange.py:104: SettingWithCopyWarning:


A value is trying to be set on a copy of a slice from a DataFrame.
Try using .loc[row_indexer,col_indexer] = value instead

See the caveats in the documentation: https://pandas.pydata.org/pandas-docs/stable/user_guide/indexing.html#returning-a-view-versus-a-copy

/opt/anaconda3/envs/scimap/lib/python3.9/site-packages/scimap/tools/_foldchange.py:109: SettingWithCopyWarning:


A value is trying to be set on a copy of a slice from a DataFrame.
Try using .loc[row_indexer,col_indexer] = value instead

See the caveats in the documentation: https://pandas.pydata.org/pandas-docs/stable/user_guide/indexing.html#returning-a-view-versus-a-copy

/opt/anaconda3/envs/scimap/lib/python3.9/site-packages/scimap/tools/_foldchange.py:110: SettingWithCopyWarning:


A value is trying to be set on a copy of a slice from a DataFrame.
Try using .loc[row_indexer,col_indexer] = value instead

See the caveats in the documentation: https://pandas.pydata.org/pandas-docs/stable/user_guide/indexing.html#returning-a-view-versus-a-copy


calculating P values
AnnData object with n_obs × n_vars = 11170 × 9
    obs: 'X_centroid', 'Y_centroid', 'Area', 'MajorAxisLength', 'MinorAxisLength', 'Eccentricity', 'Solidity', 'Extent', 'Orientation', 'imageid', 'phenotype', 'index_info', 'ROI', 'ROI_individual'
    uns: 'all_markers', 'dendrogram_phenotype', 'foldchange_pval', 'foldchange_fc'
| # Heatmap of foldchnage
sm.pl.foldchange (adata, label='foldchange', method='heatmap',
p_val=0.05, nonsig_color='grey',
cmap = 'vlag', log=True, center=0, linecolor='black',linewidths=0.7,
vmin=-5, vmax=5, row_cluster=False)
|
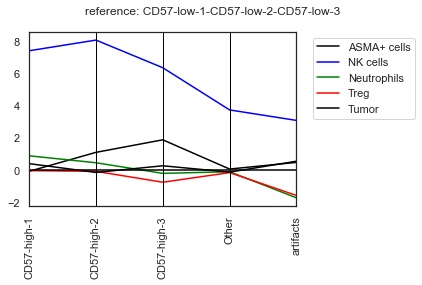
| # Parallel_coordinates plot of the foldchanges
sm.pl.foldchange (adata, label='foldchange',
subset_xaxis = ['ASMA+ cells', 'NK cells', 'Neutrophils', 'Treg', 'Tumor'],
log=True, method='parallel_coordinates', invert_axis=True,
parallel_coordinates_color=['black','blue','green','red','#000000'],
matplotlib_bbox_to_anchor=(1.04,1),
matplotlib_legend_loc='upper left',
xticks_rotation=90,
return_data = False)
|
| # save adata
adata.write(str(common_path) + 'may2022_tutorial.h5ad')
|